Link

Saturday, July 3, 2010

History


Brief history of Forex trading

Initially, the value of goods was expressed in terms of other goods, i.e. an economy based on barter between individual market participants. The obvious limitations of such a system encouraged establishing more generally accepted means of exchange at a fairly early stage in history, to set a common benchmark of value. In different economies, everything from teeth to feathers to pretty stones has served this purpose, but soon metals, in particular gold and silver, established themselves as an accepted means of payment as well as a reliable storage of value.

Originally, coins were simply minted from the preferred metal, but in stable political regimes the introduction of a paper form of governmental IOUs (I owe you) gained acceptance during the Middle Ages. Such IOUs, often introduced more successfully through force than persuasion were the basis of modern currencies.

Before World War I, most central banks supported their currencies with convertibility to gold. Although paper money could always be exchanged for gold, in reality this did not occur often, fostering the sometimes disastrous notion that there was not necessarily a need for full cover in the central reserves of the government.

At times, the ballooning supply of paper money without gold cover led to devastating inflation and resulting political instability. To protect local national interests, foreign exchange controls were increasingly introduced to prevent market forces from punishing monetary irresponsibility.

In the latter stages of World War II, the Bretton Woods agreement was reached on the initiative of the USA in July 1944. The Bretton Woods Conference rejected John Maynard Keynes suggestion for a new world reserve currency in favour of a system built on the US dollar. Other international institutions such as the IMF, the World Bank and GATT (General Agreement on Tariffs and Trade) were created in the same period as the emerging victors of WW2 searched for a way to avoid the destabilising monetary crises which led to the war. The Bretton Woods agreement resulted in a system of fixed exchange rates that partly reinstated the gold standard, fixing the US dollar at USD35/oz and fixing the other main currencies to the dollar - and was intended to be permanent.

The Bretton Woods system came under increasing pressure as national economies moved in different directions during the sixties. A number of realignments kept the system alive for a long time, but eventually Bretton Woods collapsed in the early seventies following president Nixon's suspension of the gold convertibility in August 1971. The dollar was no longer suitable as the sole international currency at a time when it was under severe pressure from increasing US budget and trade deficits.

The following decades have seen foreign exchange trading develop into the largest global market by far. Restrictions on capital flows have been removed in most countries, leaving the market forces free to adjust foreign exchange rates according to their perceived values.

But the idea of fixed exchange rates has by no means died. The EEC (European Economic Community) introduced a new system of fixed exchange rates in 1979, the European Monetary System. This attempt to fix exchange rates met with near extinction in 1992-93, when pent-up economic pressures forced devaluations of a number of weak European currencies. Nevertheless, the quest for currency stability has continued in Europe with the renewed attempt to not only fix currencies but actually replace many of them with the Euro in 2001.

The lack of sustainability in fixed foreign exchange rates gained new relevance with the events in South East Asia in the latter part of 1997, where currency after currency was devalued against the US dollar, leaving other fixed exchange rates, in particular in South America, looking very vulnerable.

But while commercial companies have had to face a much more volatile currency environment in recent years, investors and financial institutions have found a new playground. The size of foreign exchange markets now dwarfs any other investment market by a large factor. It is estimated that more than USD 3,000 billion is traded every day, far more than the world's stock and bond markets combined.

please read related articles:

http://forexandtrading24.blogspot.com/2010/06/theory-stop-loss-placement.html

http://forexandtrading24.blogspot.com/2010/06/theory-pivot-points.html

http://forexandtrading24.blogspot.com/2010/06/theory-moving-averages.html

Looking To Jump Into Forex


Looking To Jump Into Forex

Those wishing to invest their cash, for a profit, should continue to checkout Forex Facet for plenty of info on the simplest way to leap right into the foreign exchange market.

FX makes reference to ‘foreign exchange’ market ; this is the forex trading market that large banks and investment firms use to exchange trillions of dollars with one another daily. Its feasible to make a profit by exchanging your currency on the marketplace for foreign currency and making the trade back when the foreign currency is worth much more compared to the foreign currency you traded for. You will find plenty of info about the forex market. The site details the fundamentals of getting started in the currency markets for as little as $25, and offers a simple way to enroll for the foreign exchange trading platform this site has a link to.

We provide articles that are complete and detailed on reasons to trade currency exchange rather than stocks, broker registries, a day in the life of the currency exchange trader and even a starter course to currency trading. Have the need to make your cash work for you, rather than you working for it? There are masses of methods to invest your money and sure some are less dangerous, but there’s not the maximum amount of an opportunity to make profit in a really short period of time. The currency market trades 24 hours a day that means there’s a load more opportunity for making trades than on the exchange. The currency market is the way banks increase their profits, why not you? The forex market can at times appear complex and dodgy. Its in your interest to do the research on this investment methodology so you’ve got an understanding of the foreign exchange market and how it works before you jump in with both feet.

There are potential swindles that you can fall prey too when beginning to take an interest in the foreign exchange market and Forex Facet provides helpful tips and paths to avoid all of these swindles and the stress of losing money in them. Once you’ve familiarized yourself with currency exchange trading and technical terms like pip, bid, ask and margin you can be in a position to find yourself a broker or market maker to help trade currency with. Forex Facet offers links to the latest deals in currency trading systems and even other foreign exchange trading internet sites that permit you get into the foreign exchange trading market for very little capital.

please read related articles:

http://forexandtrading24.blogspot.com/2010/06/theory-when-to-exit.html

http://forexandtrading24.blogspot.com/2010/06/theory-trend-lines.html

http://forexandtrading24.blogspot.com/2010/06/theory-trading-news.html

Forex trading examples


An investor has a margin deposit with Saxo Bank of USD 100,000.

The investor expects the US dollar to rise against the Swiss franc and therefore decides to buy USD 2,000,000 - 2% of his maximum possible exposure at a 1% margin Forex gearing.

The Saxo Bank dealer quotes him 1.5515-20. The investor buys USD at 1.5520.

Day 1: Buy USD 2,000,000 vs. CHF 1.5520 = Sell CHF 3,104,000.

Four days later, the dollar has actually risen to CHF 1.5745 and the investor decides to take his profit.

Upon his request, the Saxo Bank dealer quotes him 1.5745-50. The investor sells at 1.5745.

Day 5: Sell USD 2,000,000 vs. CHF 1.5745 = Buy CHF 3,149,000.

As the dollar side of the transaction involves a credit and a debit of USD 2,000,000, the investor's USD account will show no change. The CHF account will show a debit of CHF 3,104,000 and a credit of CHF 3,149,000. Due to the simplicity of the example and the short time horizon of the trade, we have disregarded the interest rate swap that would marginally alter the profit calculation.

This results in a profit of CHF 45,000 = approx. USD 28,600 = 28.6% profit on the deposit of USD 100,000.


The investor follows the cross rate between the EUR and the Japanese yen. He believes that this market is headed for a fall. As he is not quite confident of this trade, he uses less of the leverage available on his deposit. He chooses to ask the dealer for a quote in EUR 1,000,000. This requires a margin of EUR 1,000,000 x 5% = EUR 10,000 = approx. USD 52,500 (EUR /USD 1.05).

The dealer quotes 112.05-10. The investor sells EUR at 112.05.

Day 1: Sell EUR 1,000,000 vs. JPY 112.05 = Buy JPY 112,050,000.

He protects his position with a stop-loss order to buy back the EUR at 112.60. Two days later, this stop is triggered as the EUR o strengthens short term in spite of the investor's expectations.

Day 3: Buy EUR 1,000,000 vs. JPY 112.60 = Sell JPY 112,600,000.

The EUR side involves a credit and a debit of EUR 1,000,000. Therefore, the EUR account shows no change. The JPY account is credited JPY 112.05m and debited JPY 112.6m for a loss of JPY 0.55m. Due to the simplicity of the example and the short time horizon of the trade, we have disregarded the interest rate swap that would marginally alter the loss calculation.

This results in a loss of JPY 0.55m = approx. USD 5,300 (USD/JPY 105) = 5.3% loss on the original deposit of USD 100,000.


The investor believes the Canadian dollar will strengthen against the US dollar. It is a long term view, so he takes a small position to allow for wider swings in the rate:

He asks Saxo Bank for a quote in USD 1,000,000 against the Canadian dollar. The dealer quotes 1.5390-95 and the investor sells USD at 1.5390. Selling USD is the equivalent of buying the Canadian dollar.

Day 1: Sell USD 1,000,000 vs. CAD 1.5390. He swaps the position out for two months receiving a forward rate of CAD 1.5357 = Buy CAD 1,535,700 for Day 61 due to the interest rate differential.

After a month, the desired move has occurred. The investor buys back the US dollars at 1.4880. He has to swap the position forward for a month to match the original sale. The forward rate is agreed at 1.4865.

Day 31: Buy USD 1,000,000 vs. CAD 1.4865 = Sell CAD 1,486,500 for Day 61.

Day 61: The two trades are settled and the trades go off the books. The profit secured on Day 31 can be used for margin purposes before Day 61.

The USD account receives a credit and debit of USD 1,000,000 and shows no change on the account. The CAD account is credited CAD 1,535,700 and debited CAD 1,486,500 for a profit of CAD 49,200 = approx. USD 33,100 = profit of 33.1% on the original deposit of USD 100,000.

Friday, July 3, 2009

Theory: Trade Logs

Hey all,

Well we spend so much time working on our trading systems, on when to enter, exit, move stop losses, take profits etc. etc. but how much time do we spend reviewing trades we have placed. I dare say many of us (me included at times) kind of forget about this part of the process, especially when you are on a series of profitable trades, the last thing you are thinking about is looking back at past trades.

... the irony is, if you are using any type of indicator in your trading system, you are actually trading the present based on the past ... so why shouldn't you review your trades in the same way? ...

A lot of traders only bother thinking about the past when things start going wrong, and usually it is something like "Ah yes, I remember back when I used to make money from the markets ... those were the days ...". So why should we bother looking back, living in the past so to speak? Aren't we supposed to be living in the present, looking to the future? The irony is, if you are using any type of indicator in your trading system, you are actually trading the present based on the past, as all indicators take past data, compare it to present conditions, apply some odd formula like, x+y/2*45 + your dogs age - your height, and then draw a squigly line or an arrow of some sort based on that historical data. So why shouldn't your review your trades in the same way?

The simplest and easies method of keeping track of how things have gone, and how they are going is through a trading log of some sorts. There are many ways you can do this, you could simply just write your trades on paper, or keep them in a spreadsheet, or simply add comments to your trades if your trading platform allows it and print out a monthly report. Whichever way you do it, the important thing to ensure is that what you put in your log is useful, so let's look at that.

So what should we include? Well I can only speak for myself, but here are things I have contained in a simple excel spreadsheet, with an explanation on why I include them:

  1. Open date
    This is the date that a trade was opened, useful if you want to look back and see if you are more successful on one day more than others.
  2. Open time
    The exact time of the trade, like above, to see if your trades a more successful during different times of day. You could use this to see if you trade better in a certain session, such as Asia, Europe or the US sessions. I used this to notice my strategy worked great during the Europe and US session, but performed miserably during the Asian session, which brought me to adjust things and now things are much better.
  3. Mood
    Never underestimate the power your mood can have on your trades. Write it down and be honest, you can then look to see if you have more success trading when you are happy, sad, angry, tired, alert or constipated (I don't trade well constipated trust me ;).
  4. Pair
    Of course keeping track of what currency pair you trade will soon identify your favourites, your most profitable and your most hated.
  5. Direction
    Long or short, you may be surprised by which one you favour more, for example last month 83% of my trades were short!
  6. Open price
    Price you opened your trade, a basic thing to keep track of.
  7. Stop loss
    Very useful to see what your stop loss to wins ratio is. If you are finding your wins are much smaller than the potential stop losses, it may keep you aware that a string of losses could wipe you out, so some adjustments may be needed with either riding the trade longer, adjusting your entries, or tightening your stop losses.
  8. Take profit
    As per above.
  9. Close price
    The price you closed your trade at, useful to see what your average winner versus average loser is.
  10. Closed date
    I like to keep track of these to see how long I am keeping my trades for and what it means for profits or losses.
  11. Closed time
    Again, useful to see if there is a certain time of day you seem to be closing your trades at the most, are you closing them cause you are tired and it is late at night for example?
  12. Balance
    What you made on that trade, if it is a profit, make it nice, big and green, visual reward can really be satisfying and a good motivator.
  13. Comments
    Can be potentially the most useful part, be honest with yourself, and jot down anything about the trade you liked or didn't like. Some people will only focus on the things they did wrong in a trade, but be sure to put things you did right as well, as they are just as useful if not more so for future trades.
So that is how I keep track of my trades, while it takes a little effort, it really is worth the trouble, and your trading will benefit for it. Remember though! look back on it, no use keeping your trades logged but never looking at it. The markets are closed over the weekend, so that is a good time to have a quick look through and ready your mind for the upcoming week.

Ok, I have attached a sample trading log for you all, it is a simple, unformatted excel spread but it might help someone. If anyone is good with programming excel, you can program the balance etc. to update by themselves, and please, if you make improvements, let me know so we can share it with everyone.

Read This Articles :

http://forexandtrading24.blogspot.com/2010/06/theory-trade-logs.html

http://forexandtrading24.blogspot.com/2010/06/theory-stop-loss-placement.html

http://forexandtrading24.blogspot.com/2010/06/theory-pivot-points.html

http://forexandtrading24.blogspot.com/2010/06/theory-moving-averages.html

Theory: Trend Lines

Hi all!

Time for a new theory article, this time on a very basic, but incredibly usefull tool of trend lines. Now for Marketiva users, at present you cannot draw freehand trend lines on their charts, but I have it on good authority that this feature is not too far away, so you may need to look at some online charts or other charting packages to use this tool.

Trend lines form the basis of my trading system presently (along with support and resistance lines), and can give you a good insight into where prices are going, and in which direction. They can also be used to see when a trend might be breaking but I'll go into that a little later.

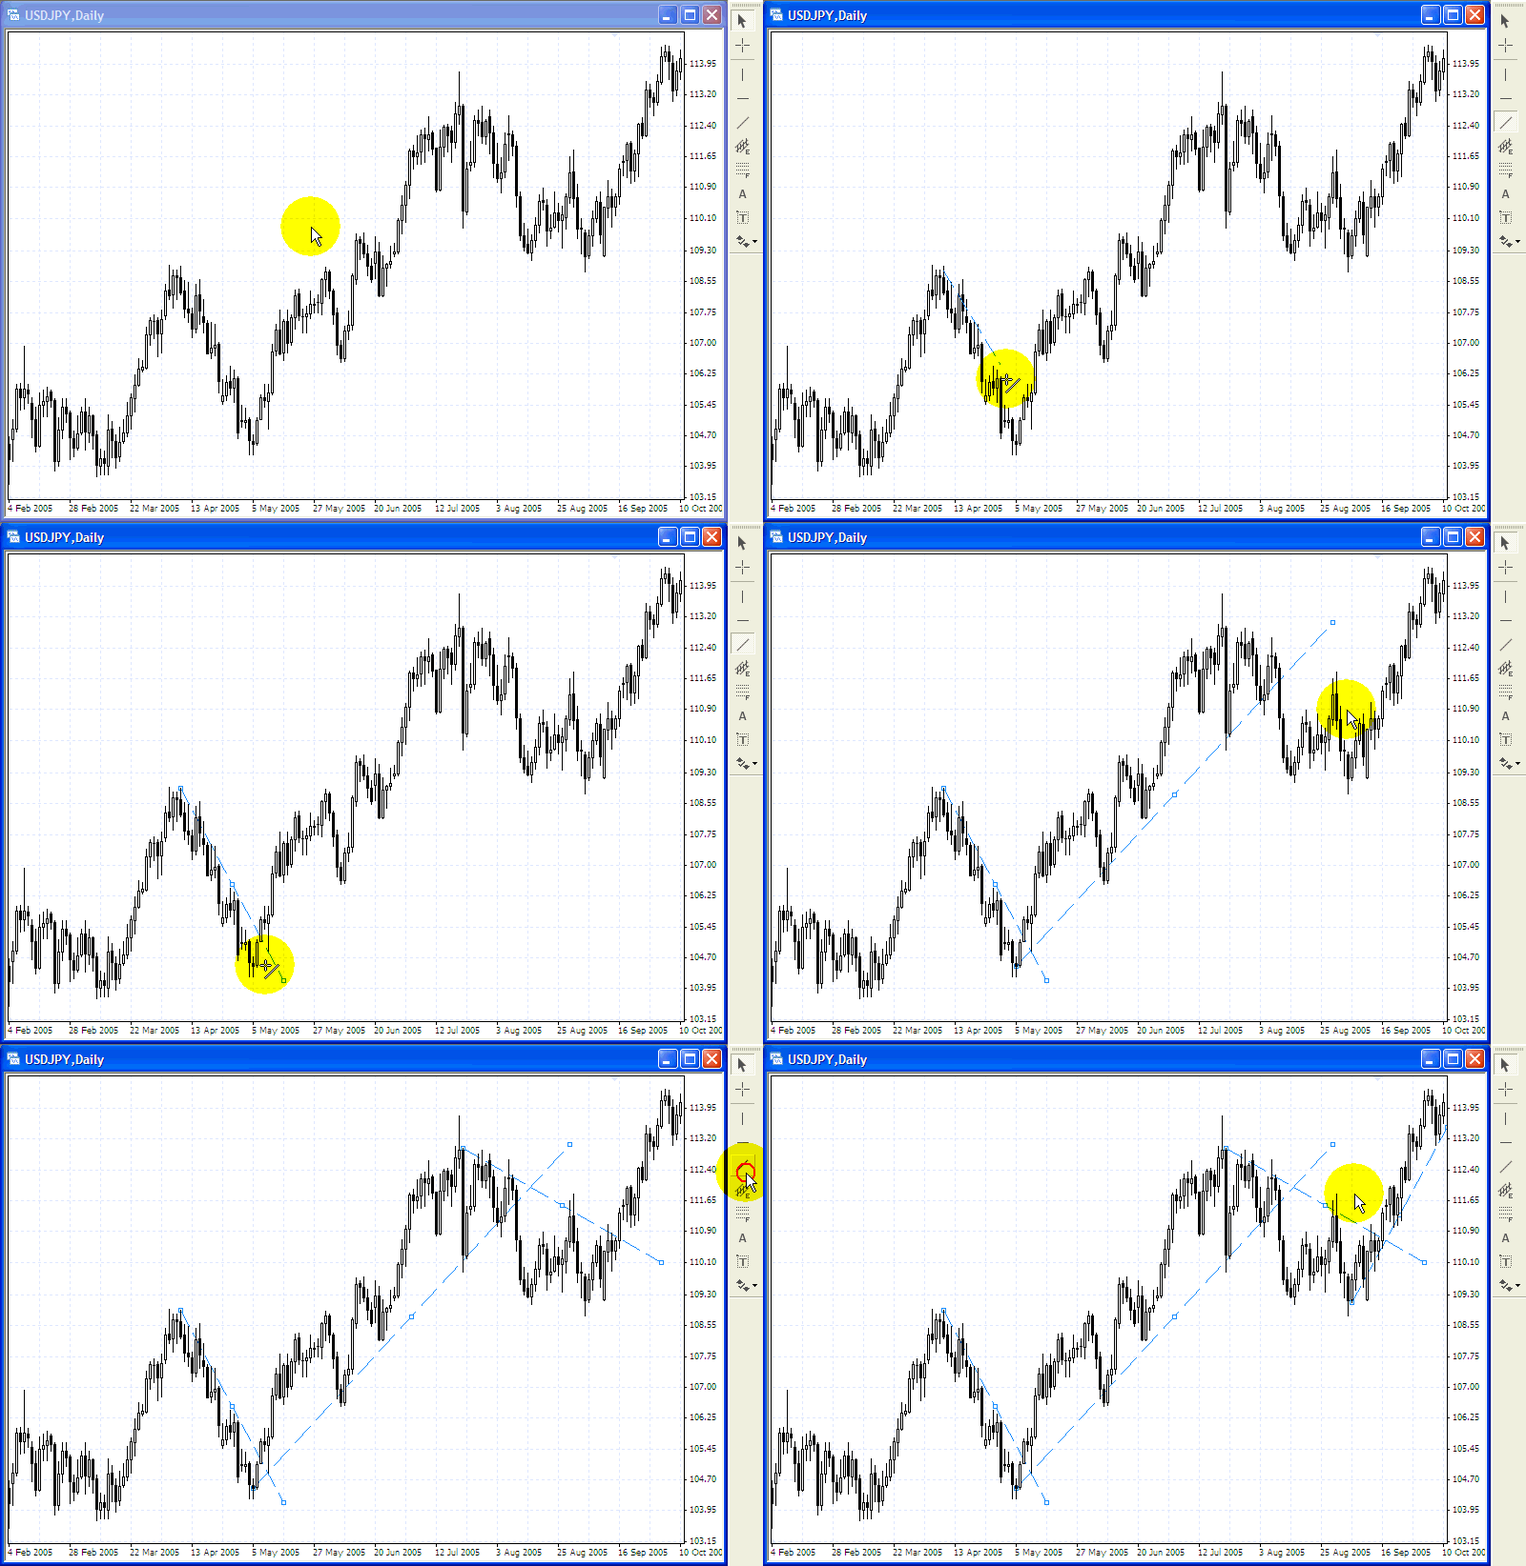
Ok first a chart from Friday just gone (click on it to see the animation):


What you seeing here (click on the thumbnail to see it animate) is the USD/JPY daily chart, and on it I am drawing four different trend lines. In a down trend, i.e. when the price is making lower lows, and preferable lower highs, you draw your trend line across each peak, the opposite applies for an uptrend, where you draw a line across the troughs. Look at the above chart to see what I mean.

... never consider a break of a trend line to be valid unless the prices closes outside the trend line ...


The basis of trend line studies, is to see what the overall trend is, and also to identify areas were the trend may be failing. In the above chart, there are four areas where a trend line was broken, in this case, you can see clearly that for a time the price then moved in the other direction, netting a very tidy profit if you read your exit correctly. Another way to trade using the trend lines is to use them to identify where the price may turn back towards the underlying trend, especially if it coincides with a support or resistance level, or a fibonacci line.

Now granted, that every trend line break does not prove to be valid, so be sure to confirm it with other tools, and I never consider a break of a trend line to be valid unless the prices closes outside the trend line on the timeframe my trend line was drawn on. You can draw trend lines on any timeframe, and a useful thing to do is draw your trend lines a timeframe or two above what you trade off, for example, if you trade off 1H charts, draw your trend lines from the 4H or daily charts. This will show you the underlying trend, and keep you in the right side of a trade more often than not.

Best of luck with this simple yet effective tool.

Happy trading!

Read This Articles :
http://forexandtrading24.blogspot.com/2010/06/international-forex-markets.html

http://forexandtrading24.blogspot.com/2010/06/forex-trading-examples.html

http://forexandtrading24.blogspot.com/2010/06/looking-to-jump-into-forex.html

http://forexandtrading24.blogspot.com/2010/06/history.html

Theory: Stop Loss Placement

Anyone who has chatted to me or written me emails will know that one of my big things is stop losses and the importance of them. I have many a debate about the topic, a classic conversation would go (usually from the same trader a couple of days in a row):

TraderJoe: Akuma ... do you think the EUR will rise today?
Akuma99: Not to sure just yet ... need to wait for support to hold

TraderJoe: What about tomorrow .. you think it will rise tomorrow?

Akuma99: Well there is some US data tonight that could effect that

TraderJoe: How about by the end of the week?

Akuma99:
TraderJoe are you holding a long position?
TraderJoe: Do you think it will go to 1.2300 by the end of the week?

Akuma99: What trade do you have? What was your entry?

TraderJoe: 1.2290

Akuma99: Long or short? ... What was your stop loss traderjoe?

TraderJoe: Well long, and I don't use stop losses, I don't like to confine my trade

Akuma99: Well there is a fair way to go before we see 1.2300, need to see if 1.2200 holds for now

TraderJoe: So you think it will rise right?


... and so it goes on, usually every day for rest of the week as prices make up their mind .... this is usually then followed by this conversation around a week later

TraderJoe: Hey Akuma ... remember me?
Akuma99: Ummm yeh sure

TraderJoe: Remember that EUR long position I had at 1.2290 last week, I closed it this morning at +10 .. see that is why I don't use stop losses, eventually it comes around.

Akuma99: Well done :) ... how did your other trades go?
TraderJoe: I didn't take any other trades ..


.... so we end that conversation with TraderJoe convinced a no stop loss policy is the best way to go, and look if it works for TraderJoe, then all power to him, but what is the main problem with the above scenario?

... suck it up, place your stop losses and be prepared to be wrong, there is no pride to be stuck in losing trades that keep you out of the most lucrative market in the world ...


The main problem with this scenario is time! While TraderJoe did eventually close in profit, it took him out of the market for a week. In essence, TraderJoe traded a whole week for a +10 profit, sure his trading log looks better cause there are no minus figures this time, but the results are far from impressive and what has he learnt? For traders starting out on a highly leveraged account, as most are while they try to build an account quickly, margin calls become a real danger, so if a trade moves the wrong way and you find yourself in a trade sitting at -100, two things happen:
  1. You are locked out of the market as you risk a margin call if another trade goes the wrong way, meaning you miss a multitude of other opportunities for profitable trades
  2. You live in perpetual fear your account being whiped out by a news event.
If TraderSally happened to be trading at the same time, with stop losses in place for all her trades, and she ended the week with 10 winning trades, 8 losing trades, for a balance of +10 for the week, which trader do you think learnt the most about trading that week? Sure the results are the same, but down the track I really believe TraderSally will be further down the trading road to profitability. Stop losses I think are vital to keep your risk definable and your enjoyment levels up. Believe me your last losing trade is forgotton easily when you close your next profitable trade (a reason to keep trading logs).

So onto placing stop losses, there are many many theories on how to place stop losses, and rather than plowing through them all here, i'll point you to a great article written over at Globetrader's site here that spells it out better than I could. Instead I'll just explain how I think of my stop loss placement. I read a great comparison somewhere, of likening stop loss placement to a game of hide and seek, and it really is a very good comparison.

I ask myself three things when placing stop losses:
  1. Where can I hide my stop loss that people won't find it?
  2. At what point is my trade no longer valid?
  3. Where do I think things will go to?
Let's run through them:

Where can I hide my stop loss that people won't find it.
This is the hide and seek theory, there are traders, brokerage houses and market makers out there that look for stops, don't let anyone tell you anything different. They look for obvious stop placement areas, and push prices to them looking to trigger those stops for their own benefit. So how do you hide them?

Let's say prices are just below what you deem as a solid resistance level, you want to place your stop just above that resistance for a short trade, think about where all the other stops may be, most likely 1 or 2 pips above that resistance level. In this scenario, I would place my stop loss perhaps 10 pips above that level, on a 3 pip spreaded pair and look for a slightly better entry, perhaps with a stop order a pip below the resistance level to keep my risk the same. If prices honour the resistance, then you are in with a fantastic entry and no drawdown, if they test for stop's just above, you have some chance of them not finding your stop.

This is just one example, and it really is over-simplistic in a complex market, but if you have the mindset of "where can I hide so they won't find me" while still keeping your risk levels in mind, then your stops shouldn't get triggered so often on those trades that end up turning your way.

At what point is my trade no longer valid?
You place a trade because you believe a trade will move in a certain direction, you can picture it in your minds eye, you can imagine how the trade would go. A stop loss should protect you against bad decisions, so place your stops at levels that would tell you your decision was wrong. If that point is too far away from your entry for your risk level, then perhaps you are entering the trade at the wrong time.

Where do I think things will go to?
This question is brought up many times in relation to risk and reward scenarios, however I think of it differently. If I picture that the EUR will be moving 10 pips down in the next hour, but to keep myself safe, I need to hide my stop behind a resistance level 20 pips away, then I don't reject the trade because I don't like the risk reward ratio, I reject the trade because I should actually be thinking about where to enter a long position rather than catching the tail end of a move down.

If in your minds eye you see a pair about to retrace slightly before bouncing, take the bounce trade .. not the last bit of the retracement, if you'r minds eye picture was right, you are in for a much more profitable trade.

There is nothing wrong with being wrong, it is human nature to avoid defeat, to not want to admit you are wrong. It is more prevalent in males, which is why it wouldn't surprise me if females made better traders, but that is a discussion for another time. What matters at the end of the trading day is your pip balance, is it positive or negative, not whether you were right or wrong.

So suck it up, place your stop losses and be prepared to be wrong, there is no pride to be stuck in losing trades that keep you out of the most lucrative market in the world, as they say ... "You gotta be in it to win it".

Read This :

http://forexandtrading24.blogspot.com/2010/06/looking-to-jump-into-forex.html

http://forexandtrading24.blogspot.com/2010/06/history.html

http://forexandtrading24.blogspot.com/2010/06/working-with-statistics.html

http://forexandtrading24.blogspot.com/2010/05/how-to-trade-forex.html

Theory: Pivot Points

Ok, it seems there are a whole bunch of people asking about Pivot Points in the chat room of Marketiva, so I thought Ill give you the theory on it, and let you all work out how to trade it. I know of a few professional traders who use pivots in their trading system, and there are a few on Marketiva as well, myself and peterb are two who come to mind.

Alright so here we go.

Pivot Points are interesting guides, and in a sense they are reliant on people using them for them to work, a self-fulfilling indicator in a way, well at least that is the way I see them. Pivot Points are worked our from the previous days, High (H), Low (L) and Closing (C) values. From these values we generate five different values, the Pivot Point (P), Support 1 (S1), Support 2 (S2), Resistance 1 (R1) and Resistance 2 (R2). Some also include a Support 3 and Resistance 3 but I can't remember the formulas for those :). Now I don't pretend to understand why the formula's are as they are but in case anyone has the urge to know, here they are:

R2 = P + (H - L) = P + (R1 - S1)
R1 = (P x 2) - L
P = (H + L + C) / 3
S1 = (P x 2) - H
S2 = P - (H - L) = P - (R1 - S1)


Rather than just spit you out a text book explanation of what these are used for, you can get that from a simple google search, this is how I have observed them so far.

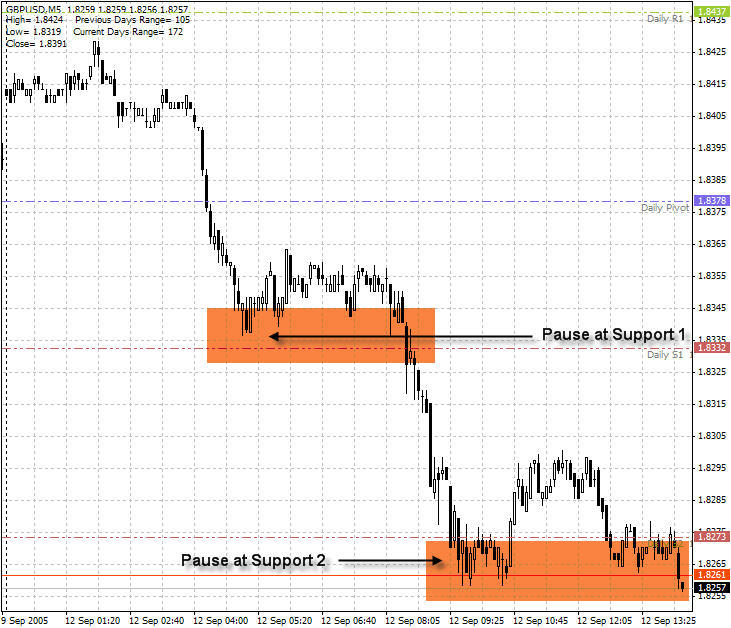
The Pivot Point are supposed to identify an "equilibrium" point, a level that prices could gravitate back towards during a days trading. Personally though I think the two most important levels to take note of are the first Support and Resistance points, R1 and S1. As prices move towards these levels, you almost always see a pause in the move, sometimes even a reversal. So if you are in a trade and are nervous about its movement continueing, a good place to re-evaluate your position is as prices move towards these points.


If you are looking for a reversal, these are also good points to look at your indicators, and if they are showing signs of a reversal, the nearby support or resistance point should give you some extra confidence. Be careful though, as there are occasions where the price is merely pausing as it approaches or hits this significant point, before moving on with the current trend.

So in summary pivots:
  • Show predicted ranges for the prices movement of the day
  • Give indications of where prices might pause
  • Give indications of where prices might reverse
So why do these work so well? One mode of thought is that as so many people use them as an indicator, then a lot of people sell/buy/wait at these points, hence my point, if a lot of people are using them, then they work, if not, then they are no more useful than a randomly drawn line on the chart.

I don't know if that makes things any clearer or not, but that is my understanding. You can use an online pivot point calculator here at fxstreet, or download one for your desktop here.

Read This Is Articles :
http://forexandtrading24.blogspot.com/2010/06/theory-when-to-exit.html

http://forexandtrading24.blogspot.com/2010/06/theory-trend-lines.html

http://forexandtrading24.blogspot.com/2010/06/theory-trading-news.html

http://forexandtrading24.blogspot.com/2010/06/theory-trade-logs.html